Cheles wastewater treatment plant, Badajoz
An operating wastewater treatment plant where the platform was developed and validated.
- Location
- Cheles, Badajoz
- Period
- 11 Sep 2024 – 5 Apr 2026 (572 days)
- Sensors
- 10
- Variables
- 33
Context
The Cheles plant operates continuously. The platform shows its data and sensor status without acting on plant control.
The challenge
The sensors of a treatment plant do not measure at regular intervals, there are data gaps and biological processes have their own dynamics. Raw data is not enough to decide: you need to know which values can be used and how far a forecast can be trusted.
What was done
- Reading of the series of 10 sensors and 33 variables, without touching the plant control.
- Validation: impossible values and frozen sensors are flagged and set aside. A real instrument failure was handled without inventing a single value: the stretch remains a documented gap.
- 24 h forecasts of key variables, such as the reactor temperature, with the span up to which each one is reliable.
- Web dashboard with the 3D model of the plant, the status of each zone and warnings.
Results
- 572days of data, from 11 Sep 2024 to 5 Apr 2026
- 10sensors
- 33variables
- 24 hforecast horizon for key variables
A real instrument failure handled without inventing data, and a 24 h forecast that the platform publishes only as far as it is reliable.
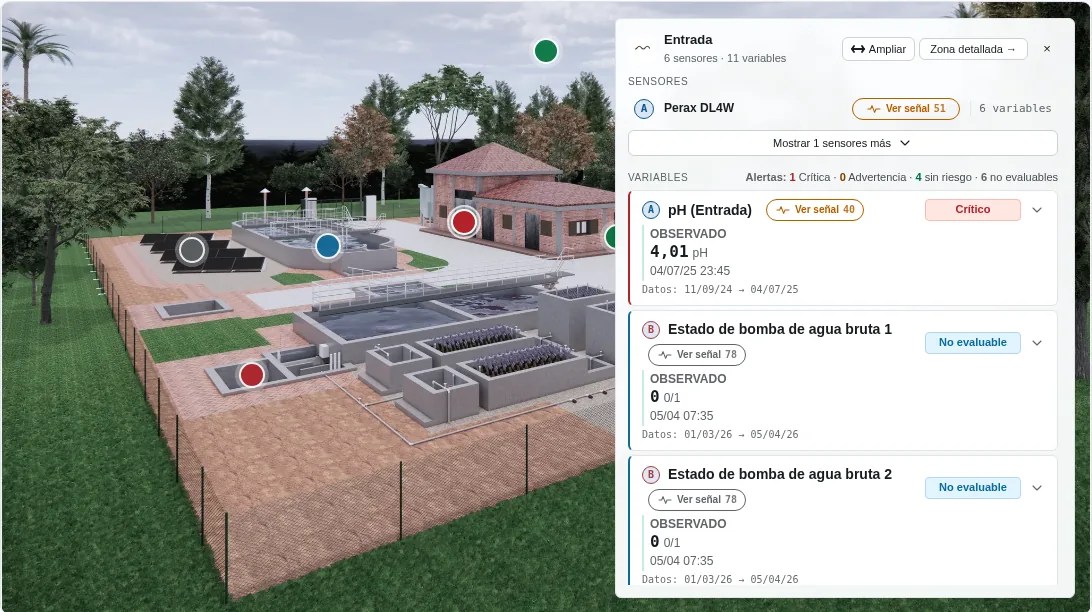
3D model of the Cheles wastewater plant, with sensors and status by zone (screenshot in Spanish).
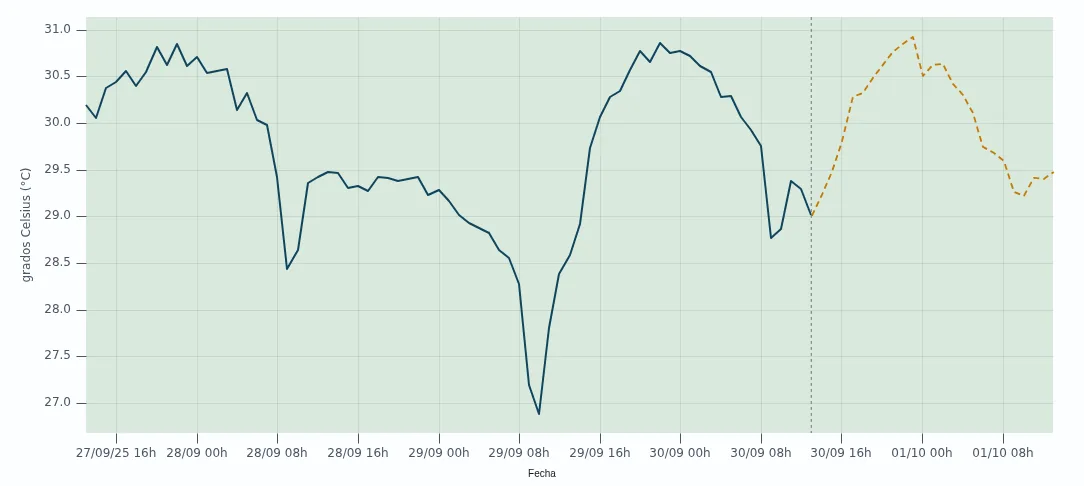
- Measured («Observado»): what the sensor has recorded
- Now: the last value received
- Forecast: the next 24 hours
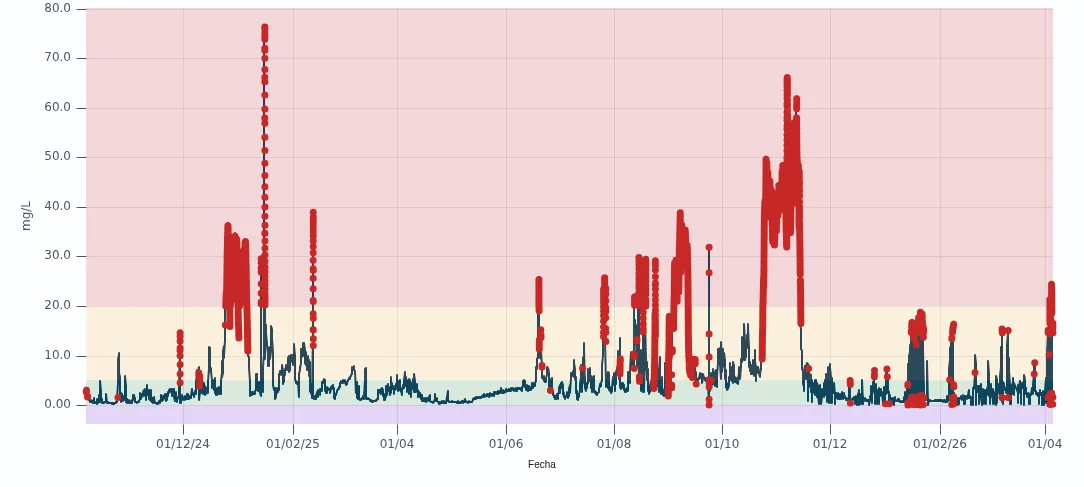
- Red dots: readings the system flags as erroneous
- Red zone: values out of range
Is your installation similar to this one?
The data assessment tells you, with your own data, what can be anticipated.