Portezuelo castle, Cáceres
Structural health monitoring of a castle with 15 sensors in 7 zones: cracks, tilts and environmental conditions, on the same engine as the treatment plant.
- Location
- Portezuelo, Cáceres
- Period
- 3 Dec 2025 – 29 Sep 2026 (301 days)
- Sensors
- 15
- Variables
- 59
- Zones
- 7
Context
Portezuelo castle is instrumented and its readings are processed with the same core as the treatment plant, through input adapters and heritage-domain rules, without duplicating the platform.
The challenge
A historic structure changes slowly and each variable behaves differently. The question is not only what will happen, but how many hours ahead the person who looks after the monument can trust the forecast.
What was done
- Reading of 15 sensors and 59 variables spread over 7 zones.
- Evaluation, variable by variable, of whether any model beats the simplest reference and up to which horizon.
- Publication only of the forecasts that pass that evaluation, with their reliability span.
Results
- 301days of data, from 3 Dec 2025 to 29 Sep 2026
- 15sensors
- 59variables
- 7zones
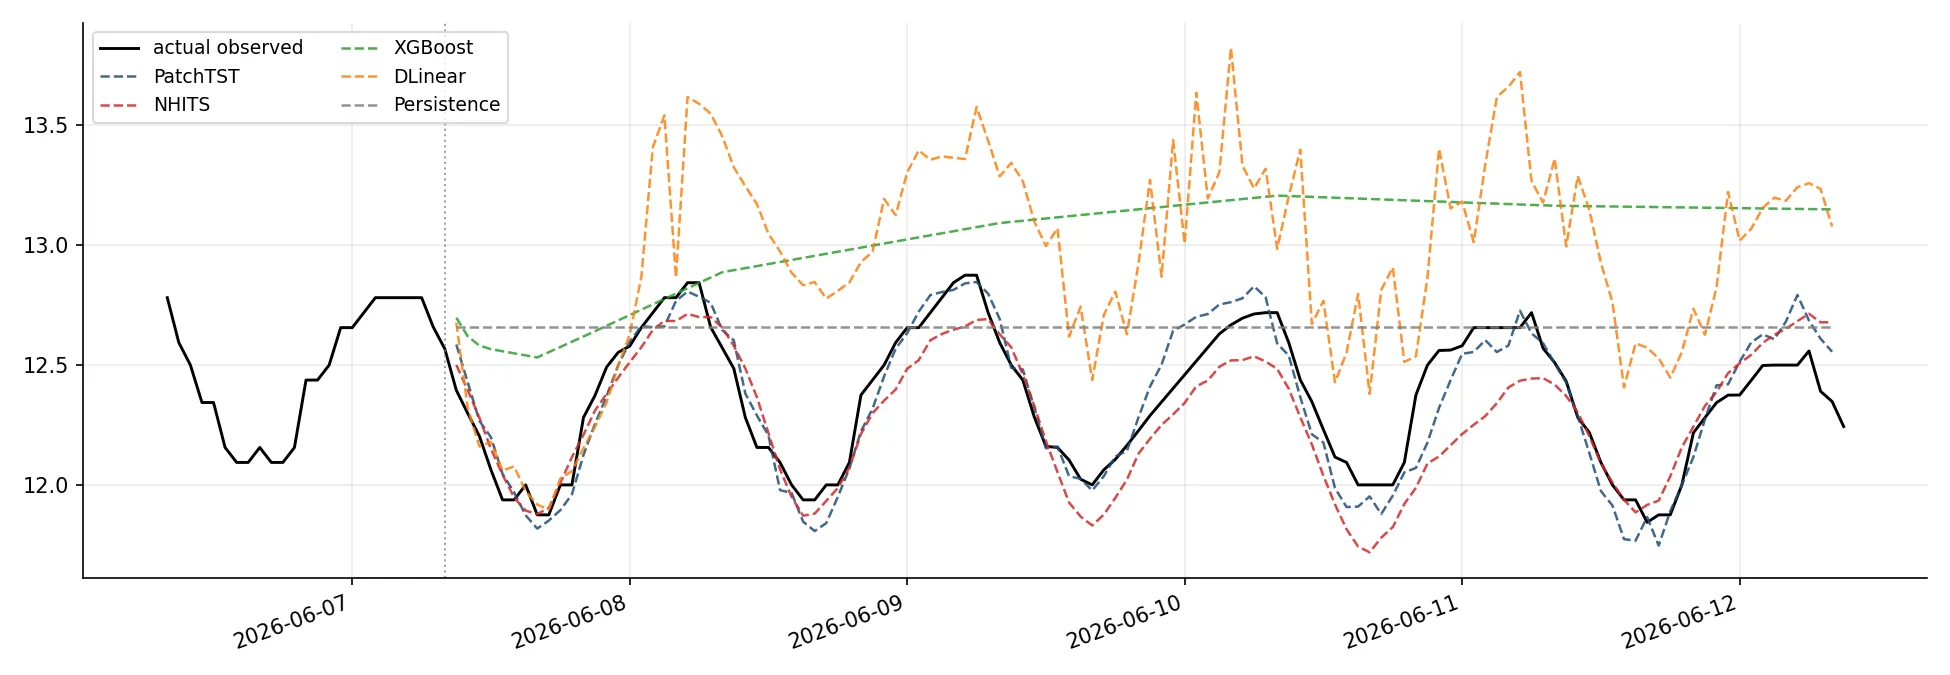
The 24 h horizon only holds for the convergences studied. For tilt X no model beat the persistence baseline (repeating the last measured value) and the platform does not publish a forecast for it. Temporal validation means forecasting stretches the model has not seen: the figure shows the last five days of a zone 2 convergence.
What is missing
Still missing are the acceptance of the real IFC (the castle's BIM model with its sensors linked) and the opening in production.
- Measured
- Served model (forecast)
- Persistence: repeat the last value
6 to 12 June 2026, with the forecast starting at the origin marked “Now”. Series traced from the original backtest figure. The vertical axis has no unit because the original figure does not give one.
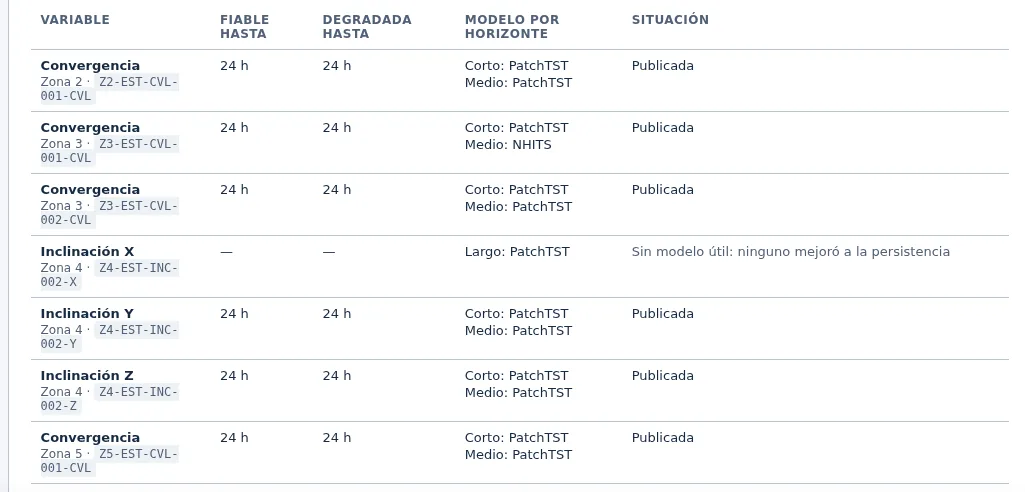
Confidence table of the forecasts by variable (platform screenshot). The screenshot is in Spanish: «Fiable hasta» is the span up to which the forecast can be trusted and «Sin modelo útil» means that no model beat persistence.
Is your installation similar to this one?
The data assessment tells you, with your own data, what can be anticipated.